 Zum Inhalt wechseln

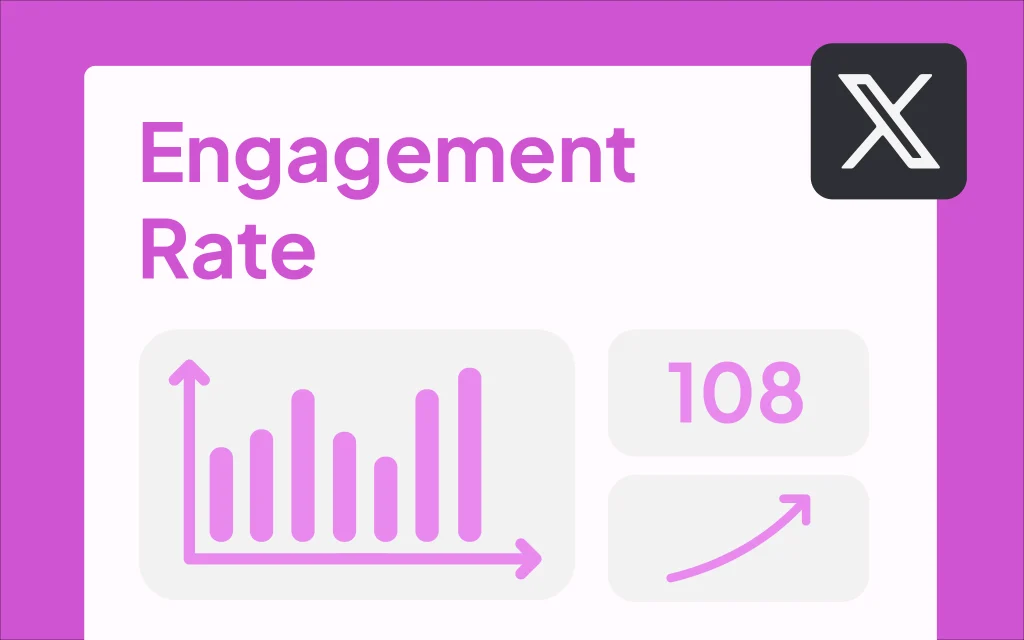
Average engagement rate on X (Twitter) in the last month
Every month, we publish the average Engagement Rate on X (Twitter), based on hundreds of thousands of tweets from around the world. With the analysis feature of DotSimple you get these and many other key figures automatically for your own social media channels - without manual calculation.
The average engagement rate on X (Twitter) in the last month was:
How is the engagement rate on X (Twitter) developing?
Standstill? Not on X (Twitter). The engagement rate is constantly changing - sometimes it rises, sometimes it falls. If you want to keep an overview of your own performance, you should regularly compare it with the average value. The following chart shows how the average engagement rate has developed over the past year.
DotSimple shows you at a glance how your own reach is developing over time - across all channels and available at any time.
Calculating the engagement rate on X (Twitter) - three ways, three perspectives
Well, there is no the one Method to calculate the engagement rate on X (Twitter). There are three. And none is inherently "more correct" than the other - it depends on which aspect you want to evaluate. Let's take a look at the differences:
1. public engagement rate
This is the most common method - and this is exactly what we use here to calculate the X (Twitter) benchmark. Since you can only use public data for competitive analyses, the key figures remain limited:
📌 Tweet ER = (Likes + Retweets) ÷ Followers
📌 ER profile = average of all tweet ERs over a certain period (e.g. last month)
Why Followers and not Impressions as a basis? Quite simply: Impressions are a private value and cannot be viewed publicly - so they are useless for a fair comparison with other profiles.
2. private engagement rate (comprehensive calculation)
Do you want the precise Calculate the engagement rate for your own profile? Then this is the best method:
📌 Tweet ER = (Likes + replies + retweets + video views + video interactions + link clicks + profile clicks + hashtag clicks + detail expands) ÷ Impressions
📌 ER profile = average of all tweet ERs over a certain period (e.g. last month)
But here comes the problem: This method is useless for comparison with other profilesbecause you only have your own data. For the competitive analysis, you therefore have to rely on the public engagement rate.
By the way: If you are wondering why the formula is not replaced by Range is shared - X (Twitter) simply does not display this value.
3. private engagement rate (only "real" interactions)
Some marketers only calculate the engagement rate on the basis of classic interactions:
📌 Tweet ER = (Likes + Replies + Retweets) ÷ Impressions
📌 ER profile = average of all tweet ERs over a certain period (e.g. last month)
The idea behind it? Likes, replies and retweets are active actionswhile clicks on hashtags or detailed expands are more "light" interactions. Video views are also a special case: on the one hand, there is no direct action, but on the other hand, it could be argued that watching a video is already a form of engagement.
What factors influence the engagement rate on X (Twitter)?
There are countless reasons why a tweet goes through the roof - or not. Here are a few key factors that can influence your engagement rate:
- Type of interaction: Are your tweets only liked or also commented on and retweeted?
- Media types: Text, images, videos or threads - what performs best?
- Algorithm updates: X (Twitter) regularly changes which content is displayed preferentially.
- Choice of topic: Some topics generate more discussion and reactions than others.
- Posting time: The day of the week and time of day play a bigger role than you might think.
- Hashtags & mentions: Is your tweet being shared through hashtags or tags?
Some factors are in your hands, others are not. But in the end, only one thing counts: Test, optimize and find out what works for your audience.
With DotSimple you plan, analyze & optimize your content in one place - efficiently, time-saving and stress-free. 🚀


